![]()
Mobility data is quickly emerging as the fastest, most powerful and most efficient way to understand your visitors and their behavior. By harnessing the power of mobile data and analyzing how people move through a destination/location learn:
- Who is visiting and where are they from?
- How long they are staying?
- What are they doing and what points of interest are they visiting?
- How does that traffic flow within your destination?
- What are your visitor demographics?
- What are the peak days and times for visitors and traffic?
Movement by RRC uses a platform which captures incoming data streams that are consensual and completely anonymized. Personally Identifiable Information (PII) is never collected.
There are many companies offering products that utilize mobility data. Most of them provide standardized reporting formats without much flexibility to meet the needs of individual clients.
RRC’s Movement dashboards are different. We work with each client to learn what type of insights they need and their goals. We are experts in making sure the data is clean, timely and accurate. Custom, interactive dashboards are created that visualize data in exactly the right format to meet the unique needs of each client.
Our team takes massive data sets that include millions of cell signals and narrows them down to the usable, relevant data for each client application. We are experts in making sure the data is clean, timely and accurate. Nothing we do is “off the shelf” so your Movement dashboard will always be designed for your specific needs.
Some examples of custom dashboards we have created include:
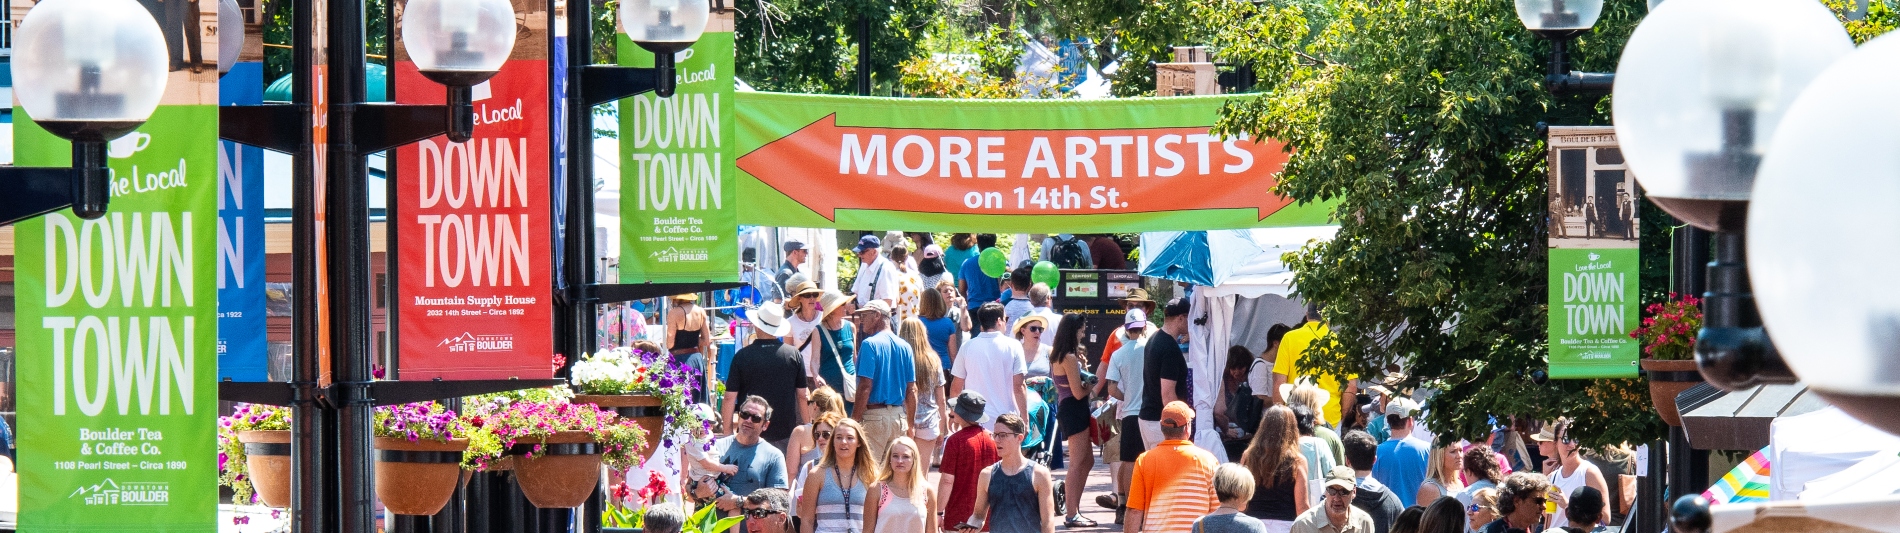
- Special events – Where do attendees come from? What is the ratio of locals and visitors? How does the profile change vs. non-event weekends? How long do they stay? How many stay overnight? How does traffic flow into, out of and within the venue? Where do attendees park? Where else in city do attendees go on event days?
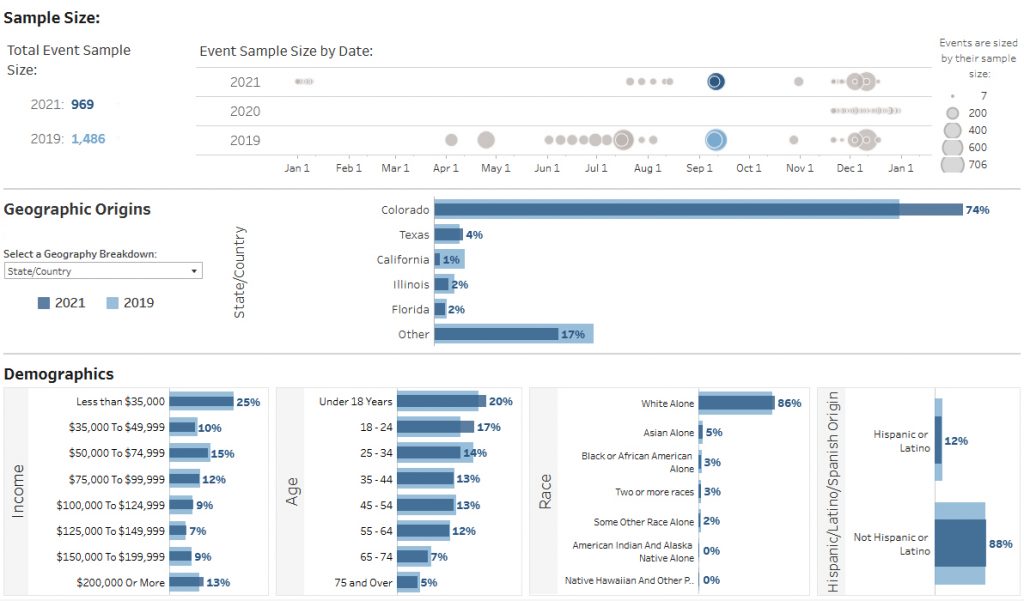
- Visitor profiles – What states and cities are visitors coming from? How many are regional vs. out-of-state? What are the demographics? How long do they stay? What attractions are they visiting? How many are overnight vs. day visitors?
- Traffic flow – What are the peak times and routes used by visitors to your park, district or city? The flow of people into, out of and within your destination is critical to effective planning. RRC can use data to capture exactly how cars and/or pedestrians move in and around your geographic area.